Olivier Doyon
Olivier Doyon is a Montreal Canadiens fan and a digital marketer, in that order. He sits on the line between millennial and gen Z, granting him the status of resident tastemaker at Vovia. When he is not waging war against sampled data sets, Olivier can be found air drumming to his favourite heavy metal tunes and manically counting his daily caloric intake. Olivier studied business and marketing at the University of Calgary
Easy Wins : 5 Quick Web Analytics Tips for the Data-Driven Digital Marketer
Today, I want to share with you five quick tips to improve your web analytics game. Now I know what you must be thinking: “Oli, how is that even possible? Google Analytics is so confusing, with its endless parade of analytics tools, charts and mind-numbing columns of numbers, not to mention that bland UI that is unexciting in the utmost…” Well it turns out that not everyone needs to be a data ninja to be able to get some immediate value out of Google Analytics.

Within a few minutes, I hope to assist your current digital marketing efforts, whatever they may be, with some surprisingly easy, albeit incredibly useful tips on navigating the murky waters of Google Analytics. Without further ado, let’s get into it!
SEO Mastery: Finding Pesky Untitled Pages
The bane of countless search engine optimizers worldwide, these website glitches are particularly enjoyable to find as they represent a near-immediate opportunity to bring value to the stakeholder. Basically, this is what happens when your website’s pages do not get assigned a title during the development phase, and thus appear as a soulless blank to Google’s prying eyes. Such an affront can put your Google organic ranking into a world of hurt. Despite the ghastly prospect I just portrayed, it turns out that there is a quick and easy solution to this problem, and it all starts with you’ve guessed it, Google Analytics!
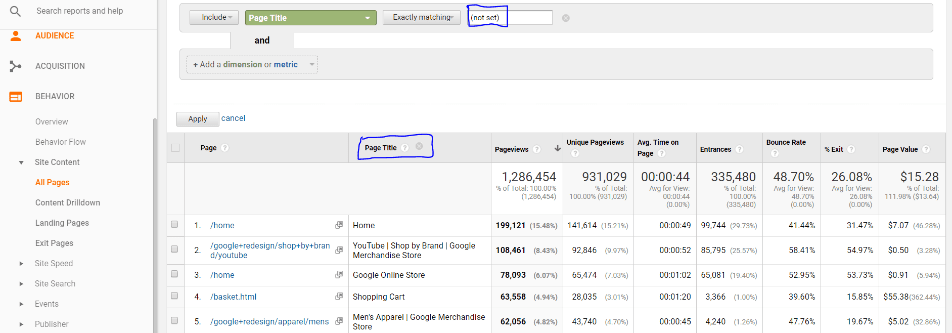
- Navigate to the “All Pages” Report located directly under the “Behavior” tab of Google Analytics’ main ribbon menu.
- Find the reporting grid at the bottom of the page and locate the “Secondary Dimension” scroll down menu on the top left corner.
- Select “Page Title” as this Secondary Dimension and watch as every single page URL is now augmented with fresh page titles by its side.
- Last step, use the search bar located in the top right corner of the report grid and enter this glorious phrase: “(not set)”. Finally lay eyes upon the final form of this report: a compendium of all your title-less pages, listed by URL and with a bevy of metrics for accompaniment. If you have team dedicated to SEO, feel free to pass along this vital piece of intel to them. Otherwise, it’s time to get to work!
Implementation Fun: Using Vanity UTMs for a Better Purpose
A few years ago, the Google Analytics community was given a most gracious gift from our Mountain View overlords: a brand new set of reports providing… live data! While this sounds incredibly cool on the surface, most analysts soon discovered that live data is quite limited in its capacity to generate quality analysis. However, not all hope was lost. It turns out that these real-time reports have lived on to support the web analytics community in the most unexpected of ways: by serving as a convenient testing tool for event and goal tracking implementations. The nifty little trick I will share with you today consists of using vanity testing UTMs to isolate the analyst’s session from the rest of the users on the site at any given moment. With this in mind, here is how to do it:
- Assuming you are already on the client’s website, navigate to the top of the screen and select the client’s URL in the address bar.
- At the very end of the URL, begin editing the field and add this magnificent string: “?utm_Source=Testing&utm_Medium=Testing”. Once this string is entered, reload your active page.
- Back into GA, navigate to the live report section and enter the acquisition sub-report. Here you will find a lone “Testing” “Testing” user under the “Source” and “Medium” dimensions (hint: that is you!). Click on either dimension.
- Voila! You can now browse your client’s website in complete isolation as the solely identifiable “Testing/Testing” user. Feel free to implement all events and goals which have been piling up on your list of to-dos. You can now test with supreme confidence as these same events and goals fire at your actions, and no one else’s.
Accounting for Seasonality: Using Time Period Comparisons wisely
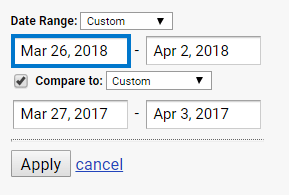
Every business faces ups and downs. Every business is tied to certain seasonal trends and patterns. While the time period comparison tool integrated into Google Analytics is a great asset to analyze such trends and patterns, it is not always used in the wisest of ways. Most often, users will select days which roughly fit their desired comparison dates for analysis without accounting for certain underlying seasonal trends and patterns. This is not good. In short, you need to ensure that your comparison time periods align on the same days of the week. Depending on your client, it’s very likely that they experience certain ebbs and flows on specific days of the week. Picking a date range without considering such a reality could lead you to exclude or overstate trends in the data which could unfortunately create some less than stellar analysis.
Quantifying Site Value: Using Goal Values for Greater Insight
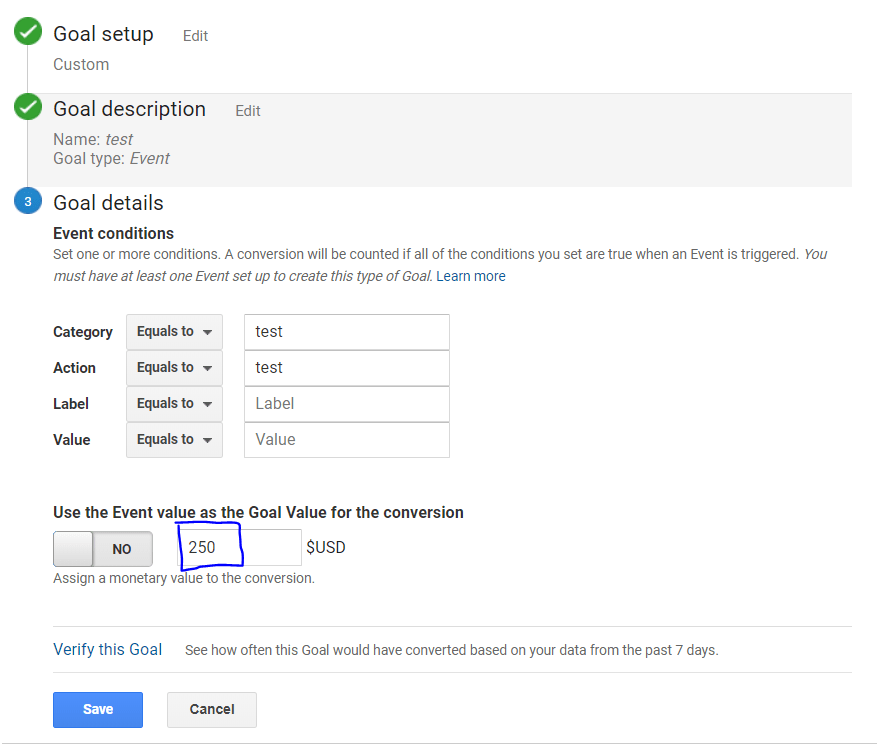
At this point in the digital marketing game, almost everyone and their mothers know about Google Analytics Goals. However, outside of e-commerce sites, assigning values (i.e. Goal Values) to these conversions is still largely a rarity! I will admit that placing a dollar value on a goal can be a daunting proposition for most, as it is truly puzzling to estimate the value of a social share, blog comment, or any number of micro-conversions of the type. On the other hand, one can rapidly compute the estimated value of a lead with some relatively simple math (i.e. Value of Lead = Average Revenue from Lead * Lead Closing Rate). Here is a written example to illustrate this:
Your website sells software suites to music producers. At $1,000 per license, it is a costly investment, but provides a solid all-in-one solution for the budding songwriter, DJ, producer, and everything in between. Despite the high value of your product, you know that most potential consumers won’t be easily swayed. Thus, you hire a sales staff to help your company move product. As some of the best salespeople around, their closing rate on a qualified lead sits at 25%. As such, you can confidently evaluate the average value of a lead to be: ($1,000 * 0.25) = $250! You are now ecstatic to be able to measure your performance at such a level of granularity.
Goal values also have an additional benefit: They allow users to unleash the power of Page Value, a fascinating metric that breakdowns the value of each page of your site relative to your set goal values. With Page Value activated, you can assess the profit-generating potential of your site content – from blog posts to explainer videos, as well as more typical site features like the humble home page and the indispensable “Contact Us” menus. For these reasons, Goal values are an absolute must for the serious digital marketer, even if they might require a bit of extra work at the start!
Easy win: Cross-Browser Testing for a greater Impact
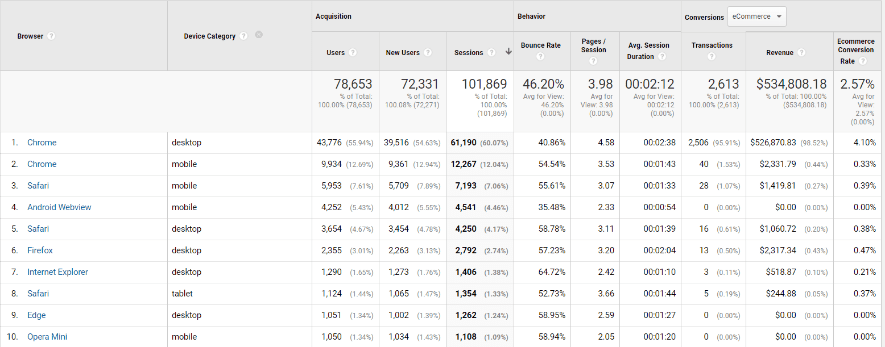
Browser-related bugs have tremendous negative impact on conversion rates. Typically, these bugs will be reflected in Google Analytics with a few, older browsers (Internet Explorer anyone?) sporting much lower conversion rates than average. While most analysts and (especially) developers will shrug this off with a dismissive “no one uses that browser anyway…”, this is a fundamental mistake. To gauge the impact of this nefarious scenario, think about this: Your most popular browsers (Chrome, Firefox, and Safari) all convert at a rate of 15%. With around 10,000 hypothetical sessions from each browser every month, that amounts to 1,500 conversions. This whopping success is partly caused by the excellent browsing experience Chrome, Firefox, and Safari provide. On the other hand, the much-maligned (but still widely used) Internet Explorer converts visitors at only a 3% rate – a huge fall from the previously boasted 15% on other browsers!
While you may contend that only a small portion of your visitors use Internet Explorer, and as such, it is not worth fixing; consider the additional conversions you could potentially generate if Internet Explorer was as smooth as Chrome or Firefox.
To go back to our hypothetical scenario: as an unpopular browser, Internet Explorer only generates around 2,000 sessions per month, and with a conversion rate of 3%, it generates around 60 leads in the same time period.
Now think about this: With a 15% conversion rate (like the other browsers), you could generate a massive 300 leads from the lowly Internet Explorer! I doubt anyone will question the necessity of fixing up the user experience on Internet Explorer after seeing data like this. Moral of the story? While it may be tedious work, a few hours of developer time are more than OK for fixing browser bugs!
Well there you have it folks! I hope you were able to learn a thing or two, absorb knowledge, or at the very least, have some fun reading this article. Check back every now and then for some fresh articles from yours truly on digital analytics and their implications in the agency world.