Lauren Leung
Lauren is a self proclaimed marketing nerd who loves to analyze, organize, and colour code EVERYTHING! Lauren also loves to hang out at the gym or in the mountains, and has an (unhealthy) obsession with Disney movies.
Media Consumption in Canada: A Mosaic of Marketing Strategies
It’s halfway through summer, but more importantly, planning season for many of our clients! At Vovia, we believe in data-driven performance, which means using first and third party data to support our recommendations for every client’s plan. Canada is a mosaic of cultures, which significantly impacts the success of our marketing decisions. What works in one province may not work well in another! Today I’m going to highlight why it’s so important to use data relevant to the geography and audience that you are targeting, and what’s unique within Canada.

Do Canadians Behave the Same as Americans? Brits?
Let’s face it; Canadians aren’t always in the spotlight for research. It can be easy to look at US or UK data (two countries we are commonly compared to) and assume that Canadian habits are the same. However, we must take US data with a grain of salt before using it to support recommendations for Canadian plans because there are many differences spanning from device usage to general media consumption.
Here are a few examples where research from our international neighbours may paint the wrong picture for a Canadian target audience:
Mobile Consumption
The biggest difference by far is mobile consumption. According to a 2017 comScore study, Americans are spending almost 40% more of their digital time on a mobile device compared to Canadians. Our counterparts in the UK are more similar to us in mobile usage, but still spend an average of 12% more time on mobile than Canadians do.
This is explained by the relatively high cost of mobile data in Canada. According to a recent study conducted by Tefficient, Canada uses the least amount of data due to its extremely high cost. How high? Canada pays up to 35x more than the lowest data rate countries (India, followed by Finland).
The takeaway? If we use US/UK mobile behaviour data for Canadian campaigns, the mobile recommendations may not reflect actual Canadian habits and behaviour.
Technology
Another key difference, many of the newest technologies are released in the US/UK before Canada, and as a result, preliminary data on these technologies typically do not align with Canadian habits.
A great example is smart speaker penetration. A recent study by Edon shows that smart speaker penetration is already at 17% in the US, only four years after initial release. While this sounds low, Voicebot.AI points out that it took television 13 years to reach a similar penetration rate.
In Canada, smart speakers are still in the first year of being released, so penetration is only at 8%. So again, if we use US data on new technologies to recommend innovation media strategies, we may overstate just how much reach these new technologies currently have.
TV
Finally, US and UK television consumption is also far different than Canadian usage. According to the American Television Bureau of Advertising in 2016, Americans on average are spending about 34 hours a week watching TV, whereas English-speaking Canadians are only spending about 27 hours per week (Numeris, 2017). Even our British counterparts are watching more TV (31 hours per week) than English-speaking Canadians, according to IPA Touchpoint in 2017.
It’s important to note these differences (among others) as they can help us sift through US and/or UK research and give us a better idea of how relevant the data could be to Canadians.
What About Within Canada?
Now let’s look at the differences within Canada. From our experience with clients running national campaigns, we have learned that not all provinces behave or respond to media channels in the same way. These learnings have reinforced the notion that our media strategies have to be customized by province. Depending on your target audience and objectives, different provinces may have more potential for success than others.
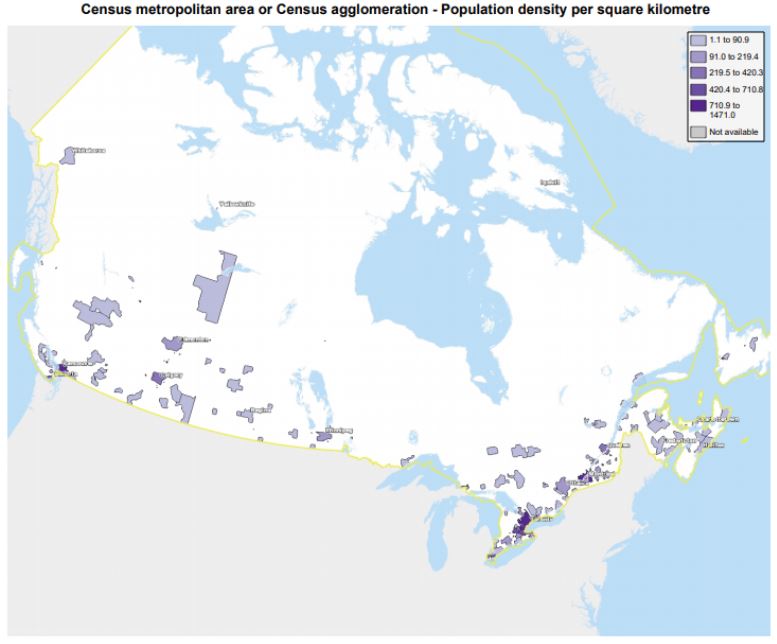
The first thing to consider when building a national strategy is population. In the figure below, you can see how the population density varies drastically by province. In the smaller provinces, there are fewer metropolitan areas and those metropolitan areas are less dense. Compare that to a province like Ontario, where there is significant population density and many metropolitan areas.
How does that help guide where to target? Consider the difference in reach by channel for rural and and urban residents. According to CIRA, only 87% of rural residents have access to any form of Internet, while in urban areas, access is always available. Within these rural areas, the fastest speed they have access to is comparable to a turtle going through molasses for us fast-paced urbanites. This impacts the time they spend online compared to urban areas (even lower than the national average, which is lower than our international friends).
This information can be used to find the best areas to target (Urban vs Rural) and can also help you assess the feasibility of running a campaign in certain areas in terms of scale and volume potential. Looking to target a millennial who has an interest in eco-friendly sports clothing? You will probably get a large enough audience to target in Ontario. In a smaller province such as Saskatchewan or Manitoba, the same targeting criteria may not provide sufficient reach.
For Offline Media, we look at whether targeting that audience would yield a good return on investment. How much would it cost to reach the audience on a cost per thousand (CPM) basis? In rural areas, the geography you target may not even be available for online ads due to small audience sizes. This is where offline channels can support and help you get your message into market.
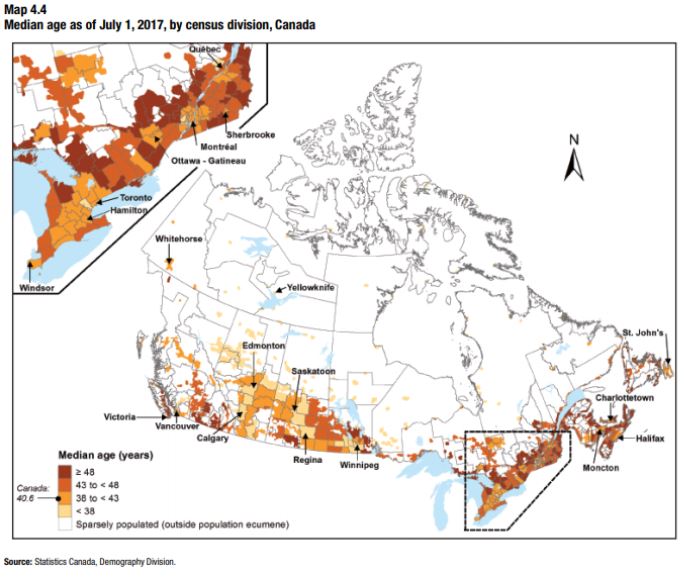
Demographics also vary greatly by province. According to Stats Canada, the population in the prairies has grown significantly in recent years and the average age is younger than the rest of Canada. So if you’re looking for Gen Z and Millennials, you may want to focus more budget there. On the other hand, Ontario and Quebec cities have an older average age compared to rest of Canada, so if you have a hearing aid or life alert product in play this might make for a better target.
We can also see different media habits in these regions in the Numeris research, which can be layered into your population and geo targets. For example, the 25-54 age group in Ontario/Quebec has a higher propensity to read magazines and community newspapers compared to other provinces.
Finally, you can also find pockets of ethnic populations in certain areas of the country. Good old Stats Canada tells us roughly 21% of the Canadian population speak a non-official language at home. That’s over 7.3 million people! In the prairies and territories, the most commonly spoken ethnic language is Tagalog (the language spoken in the Philippines). In Quebec, Newfoundland, Nova Scotia, and New Brunswick, it’s Arabic. Ontario and PEI? Mandarin. And BC is the only province where Punjabi is the top immigrant language. The national census data gives us a good idea where these pockets lie, and this can help inform your channel selections and targeting strategies in these regions so you can hit the ground running.
In practice, Vovia used this type of research to drive sales for a special type of insurance for long-term visitors to Canada. Using research from the national census, we discovered that Winnipeg had a high concentration of Filipino audiences, and thus was a strong target for the campaign on a limited budget. We chose Facebook because of its ability to narrowly target Filipino audiences and leveraged creative and messaging tailored to Winnipeg. In 2017, this strategy drove a Return on Ad Spend (ROAS) of 2.04 within the first month. In 2018, through learnings and optimization, we drove 250% more purchases than the previous year with the same creative.
If you can hit the right target and the right message at the right time, they are always more likely to convert. And, without this research and insight gleaned through it, these results would not have been possible.
The Melting Pot
So as you can see, our mosaic of cultures in Canada does impact our marketing efforts and highlights the importance of research for both audiences and media habits before committing to your national budget. There are endless possibilities when it comes to your media mix, which makes this information critical during the planning phase of your campaigns.
Need help with that research? Get in touch! We have over 100 years of media planning and buying experience that can be put to work for you.