
Jeremy Kitson
Jeremy is the VP of Digital Media at Vovia. He loves all things digital and has an insatiable appetite to learn new things. He spends his free time riding his bicycle in the mountains and backroads of Alberta.
Best Practices and Benchmarks for Your Email Marketing Strategy
What is a good open-rate? What is a good click-through rate? What day and time should I send emails for the best results? These are all good questions that we are used to hearing when it comes to running email marketing campaigns and like with many things in the marketing world, the answer is often – “It depends”.

Not to fear, though – there are good reasons why the answer is “it depends”. Every business and industry is different, and it is sometimes difficult to come up with general email marketing benchmarks to evaluate performance against. To determine reasonable benchmarks, we need to look into things like the historical performance of past campaigns, total audience list size, geographic location(s) being targeted, the industry you’re in, segmentation method being used etc. The list goes on and on. With all these variables, it’s no wonder why there aren’t any concrete benchmarks.
Today, we’ll go through some recent Email Marketing studies that show why “it depends” is totally valid, and the importance of developing your own benchmarks for your email marketing strategy based on your own data.
The first study we’ll look at is from a report GetResponse released in the summer of 2019. GetResponse is a leading international email marketing provider. They performed an in-depth analysis of over 4 billion emails sent by its customers from January to June 2019. Another large email marketing platform, Campaign Monitor, also released a similar email marketing benchmarks report in the past few months and when you compare these two reports, the results are totally different. This is not a bad thing though. It just underscores the importance of using your own data to develop benchmarks that work for you.
With that said, we’ll make the caveat now to NOT take the numbers reported in this post as gospel, but rather as a point of comparison to help guide your decision making when it comes to developing benchmarks for your email marketing campaigns.
Benchmarks by Location
We’ve previously discussed how users in different countries behave differently in terms of media usage. It’s no surprise that the same goes for Email Marketing. The GetResponse report provides a detailed breakdown by country, and it illustrates just how different user behaviour can be based on the location you are sending to.
For example, while Canada and the US have similarities with some of the metrics, results from Australia are very different.
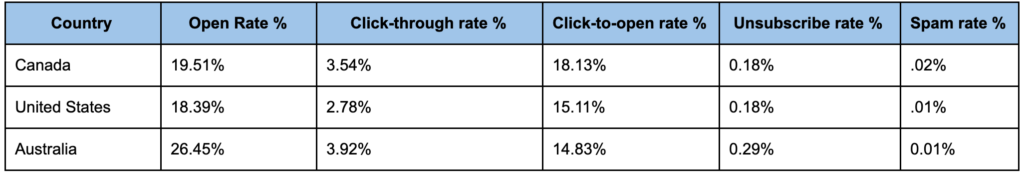
The main learning here is that segmentation of your lists and collection of details like the location of your subscribers is important as it can play a significant factor in determining your benchmarks. This is particularly important considering how policies like the GDPR in Europe, the upcoming CCPA in the United States, and CASL in Canada can play a role in how you can market to your subscribers based on their location.
Benchmarks by Industry
Now that we have an idea of some general benchmarks to target with your email marketing campaigns, we can throw industry stats into the mix. While geography can play a major factor in campaign performance, the industry you are in is equally or more important than geo when it comes to setting expectations for performance.
You can see below how metrics can vary drastically by industry:
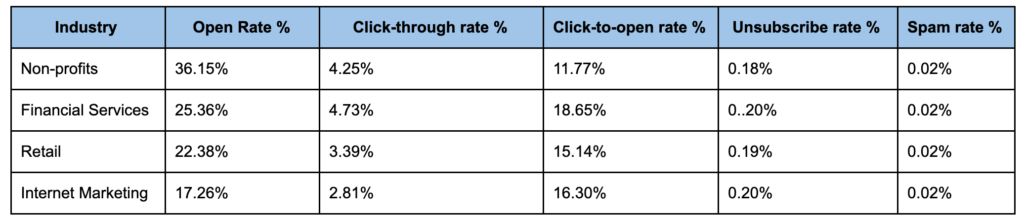
So, you stand a much better chance of getting someone to open your email if you are fundraising for a non-profit vs. getting people to open an email about digital marketing….oh wait.
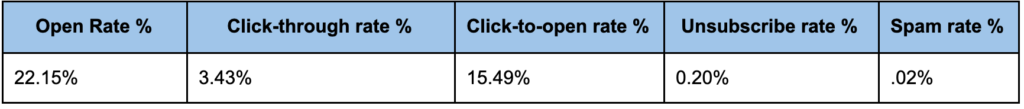
General Benchmarks
When you look at all of the data combined, the global average for general benchmarks are:
When to Send Your Campaigns
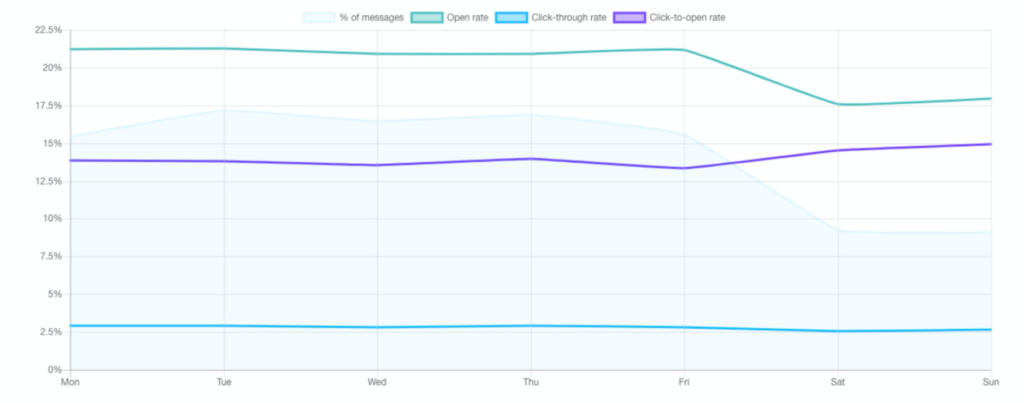
Another common question is “What day and time should I send my email marketing campaigns for the best results?” As you’ll see below, depending on your objective, the best time of day to send will vary.
When it comes to getting the highest open rate sending at 10:00AM or 1:00PM are ideal; but if you are going for highest click-through-rate, 6PM is your best bet.
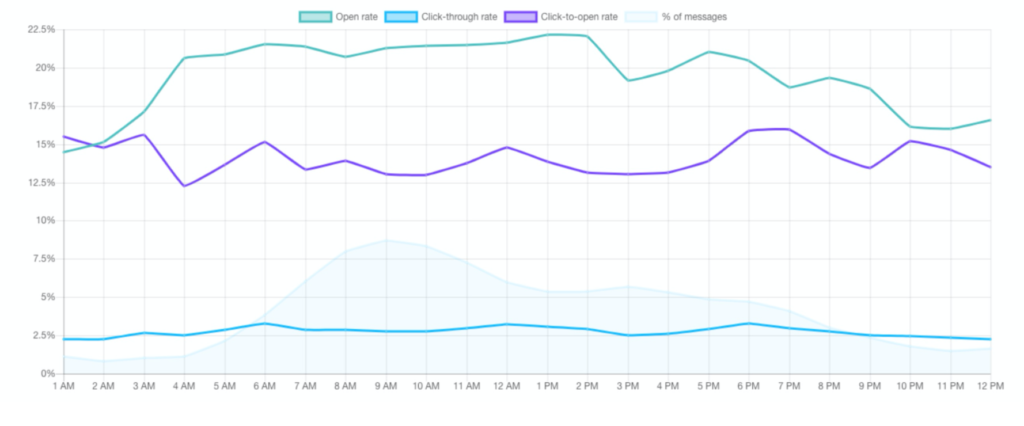
For days of the week, again, the results would seem to suggest that it depends on what your goals are. Monday and Tuesday lead the way when it comes to opens and clicks, with all weekdays performing in a similar fashion. The weekend is a very different story with a drop in open rates, but an increase in the click-to-open rates. This means that people opening your emails on the weekend are likely more engaged than they would be during the week. This makes sense as they likely have more time to spend on things on the weekend.
The good news here is that most platforms now offer AI-driven scheduling tools that consider your past results, industry results, and your main goals to make a suggestion on what time you should schedule your campaign to send. While AI is a great tool, it still makes sense to test it against the day/times you may think are best to compare your results against.
Email Opens and Clicks Over Time
Once you have sent some emails, the question becomes “how long should I wait before measuring the results?” Is it a few hours, a day, a week? This question is also important when you’re running an A/B test for a campaign where you typically send to a portion of your subscribers for a target list or segment and then send the winning test to the remainder of the subscribers for that list. For this to work, it is important to know how long you should wait to determine the results.
The findings in the report indicate that around 19% of all email campaigns are opened within the first hour after they are sent, and around 50% after 6 hours. This is really helpful information as it can be applied to other channels that may be used as part of your sales funnel. If you are running a very time-sensitive campaign, you may want to target subscribers that haven’t opened an email via a remarketing campaign after that initial 6-hour window has passed in order to get the offer in front of them.
Between hours 7-24 after sending, an additional 26% of subscribers will open your email, meaning that around 75% of your opens occur within the first 24 hours which is a reasonable period to measure against. But, don’t stop measuring after the first 24 hours! You could find that subscribers engaging after that time frame could drive valuable goal completions and it would be a shame to not be aware of this. As we always tell ourselves at Vovia, make sure you keep an eye on the big picture.
Marketing Automation Works Really Well
The last thing we want to discuss from the GetResponse report is the results by message type. This includes triggered, autoresponder, newsletter, and RSS. Specifically, the results for triggered email messages or messages that were sent via a marketing automation platform based on the actions of a subscriber.
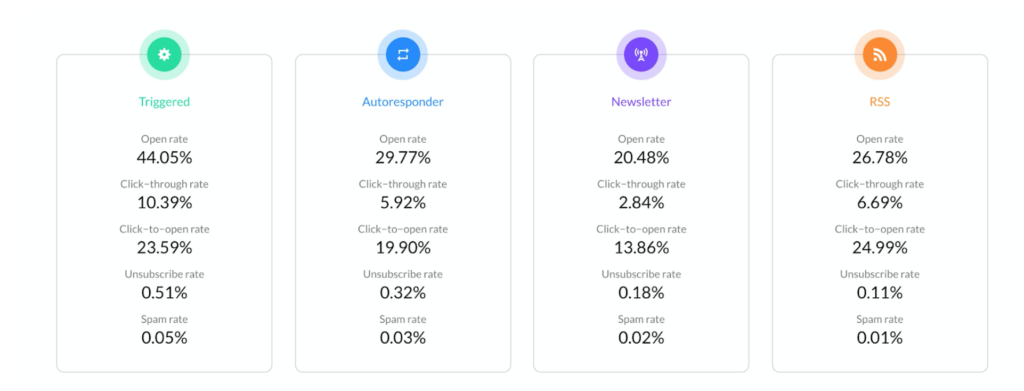
We have all seen a Triggered email before; you’re browsing products on an e-commerce website and then BOOM you get an email from them moments later with information related to what you were looking at. This is marketing automation at work and it is very effective. According to the report, the average open rate for triggered emails is an astronomical 44.05% with an equally impressive 10.39% click-through rate and 23.95% click-to-open rate.
These great results are driven by the fact that the content of a triggered email is very relevant to something a subscriber was already looking at, which makes it much more likely that they will engage with content. Especially if it is some type of special offer or discount.
The drawback of Triggered emails is that they also have a much higher unsubscribe rate and spam rate as users may find them intrusive or a bit creepy and decide to opt-out. You also need to have a sufficiently large list size and volume of users for this to warrant the investment in the initial setup which can be time-consuming and thus costly to get up and running.
Again, the takeaway here is that the benchmark numbers are not a one-size-fits-all number. Even within your own email program, the benchmarks can vary widely depending on the campaign types you are running.
The Tip of the Iceberg
The stats summarized here are definitely just the tip of the iceberg. The GetResponse report offers a ton more information and I encourage you to go check it out.
Benchmarks for your email marketing strategy can be very dynamic and determining what is important to you and why is the first step in laying the foundation for a sound email marketing strategy.
Hopefully, this provides some visibility into the “it depends” factors of email marketing benchmarks and helps you to create your own, realistic benchmarks for your campaigns. I would love to hear what types of benchmarks you use and why.