Lauren Leung
Lauren is a self proclaimed marketing nerd who loves to analyze, organize, and colour code EVERYTHING! Lauren also loves to hang out at the gym or in the mountains, and has an (unhealthy) obsession with Disney movies.
How to Interpret Data Sampling in Google Analytics
S.mpl.ng – What You Need to Know
Sampling – making inferences about a large population based on data from a portion of that population. It helps us quickly come to conclusions, such who is the most favoured politician. This all looks good on paper, but the unfortunate truth is that sampling can sometimes be misleading. No matter who the sample suggested that voters favour, election day can sometimes reveal a different story.

In Analytics, we are always looking for the truth, especially when it comes to website data. Website data is incredibly valuable to marketers and we base many important business decisions on it. So, if the data does not reveal the whole truth, how can we make good business decisions?
If you just asked yourself “Why would my data not reveal the truth?”, you have come to the right place! I’m going to show you how sampling in Google Analytics works, and how it can sometimes mask the truth behind your website data.
How Does Sampling Work in Google Analytics?
Google Analytics (GA) gives you access to valuable information about your website, from the number of visitors over a specific time period, to specific webpage behaviour, to specifically defined on-site conversions. GA will collect all of this information, process it, and spit it back out with lovely tables and graphs for easy interpretation.
For free GA accounts, this data is processed on a daily basis (this is what you see when you explore GA without filtering the data). However, if you want to add a secondary dimension, segment, or filter, GA will process the information and generate a customized report for you on the fly. That said, it’s not without its limitations.
GA likes to give you data as fast as it can. Consequently, if your GA enabled website has more than 500,000 sessions within the time period you select, it will start to sample your data so it can process faster. The exact method Google uses to determine your sample is a mystery, but it “uses a sample set proportional to the distribution of sessions by day for the selected date range“.
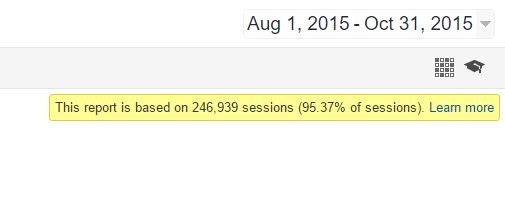
The more visits you have, the more it will sample, and adding more complex filters, segments, or secondary dimensions will force GA to sample even more. If your data does end up getting sampled, GA will notify you in the upper, right-hand corner of the page (see below).
 How Does Sampling Affect My Data?
For the most part, GA can sample simple metrics fairly well. Since the algorithm is designed to mimic the traffic trends by day, sessions in a sampled report are typically very close to the truth; however, the behaviour within each session seems to be ignored in the sampling process. There are a couple of very important metrics that sampling will impact:
Goal Completions and Cost per Conversion
If visitors to a site are human (why are non-humans on my site?), we should expect all of them to behave a little differently. Some will be very engaged, others will not. But when GA samples your data, it does not consider the behaviours within each session.
For example, let’s say you are tracking registrations, calls, and emails as goals in GA. When GA samples, it may exclude sessions where there were many goal completions because it samples by traffic patterns, not by goal patterns. In my experience, I have seen variance as much as 10% from the actual amount of goal completions, which can seriously affect the decision making process…
When you run an SEM campaign, Cost per Conversion is calculated through the measurement of Goal Completions in GA vs the cost of driving that traffic to the site. But if GA is not giving you accurate goal completion data, it will inevitably affect your equation. The variance in Cost per Conversion is directly proportional to the variance in your goal completions, so a 10% variance could make your numbers look much less favourable than the true performance. Not fair!
Revenue, Weighted Revenue, and ROAS
Similarly, if you have values associated with each goal in GA, sampling will affect your Weighted Revenue calculation. Even worse, when measuring e-commerce data – GA could be excluding actual revenue! When you calculate ROAS (return on ad spend), the variance is directly proportional to the variance in Weighted Revenue. All of these metrics can be skewed by sampled data. Definitely not fair…
Help, My Data is Sampled!
If GA samples your data, do not panic. Here are some things you can do to avoid sampling:
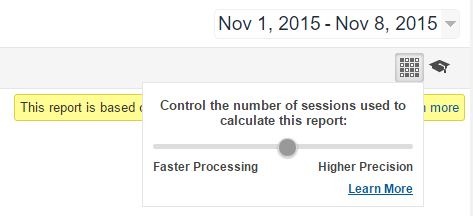
Adjust the sampling rate in GA – If a report is sampled, you can adjust the sampling rate in the top right corner. Click on the box with the black dots and slide the dot all the way to the right (Higher Precision). GA will go back and run the report again at the lowest sampling rate possible. Sometimes this can eliminate sampling completely, but be patient. Running reports at ‘Higher Precision’ will take a bit longer than usual.
Adjust your date range – Think about what you really need out of the data. Can you get the same information out of a shorter date range? If so, use the shortest date range possible. This will decease the amount of sessions GA has to process, thereby reducing the likelihood of sampling.
Adjust your segments or filters – More complex filtering or segmenting will increase the chances of sampled data. Is there a simpler way to filter your data? Try another approach — there are many ways to get the same data in GA.
Help, My Data is STILL Sampled!
If you have gone through all of the steps above and your data is still sampled, there many tools and solutions out there to remedy this, such as ‘Analytics Canvas’. Amongst many other helpful features, Canvas can divide the time frame you want to pull into smaller reports, then combine them after the fact to provide you with an accurate total for the entire date range specified.
Another option is Google Analytics Premium. If your website consistently serves a large volume of traffic, you may want to consider upgrading to this paid solution. With Premium, sampling starts much later — 25 million sessions per view, rather than 500,000 sessions per property in free GA. It does come with an expensive price tag; however, if you’re serious about your data, this is definitely the way to go.
Now that you know the basics of sampling, you know what GA can hide from you. Use these strategies to reveal the truth to your website data so you can make the best business decisions possible.
Have questions about sampling in GA? Drop me a line in the comments below. I look forward to hearing from you!